QuickStart
Install ODSCharts
The easiest way to install ODSCharts is:
pip install odscharts

    OR on Linux
sudo pip install odscharts
    OR perhaps
pip install --user odscharts
In case of error, see pip Error Messages
Installation From Source
Much less common, but if installing from source, then
the best way to install odscharts is still pip.
After navigating to the directory holding ODSCharts source code, do the following:
cd full/path/to/odscharts
pip install -e .

    OR on Linux
sudo pip install -e .
    OR perhaps
pip install --user -e .
This will execute the local setup.py file and insure that the pip-specific commands in setup.py are run.
Running ODSCharts
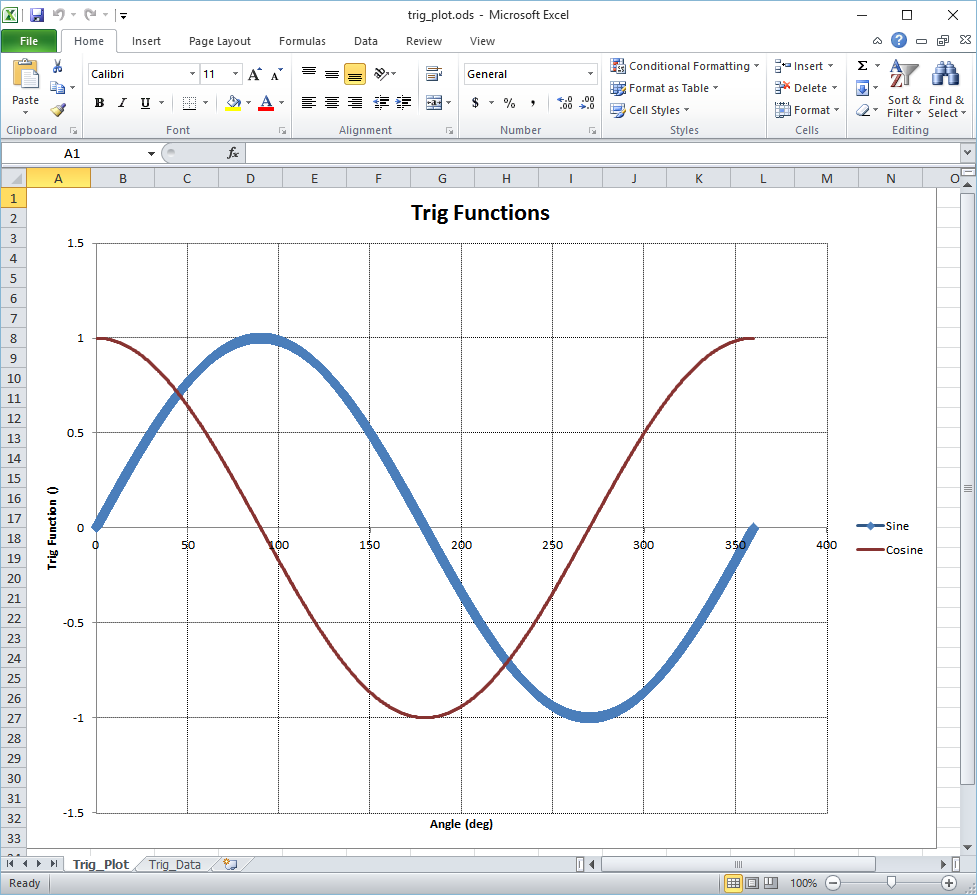
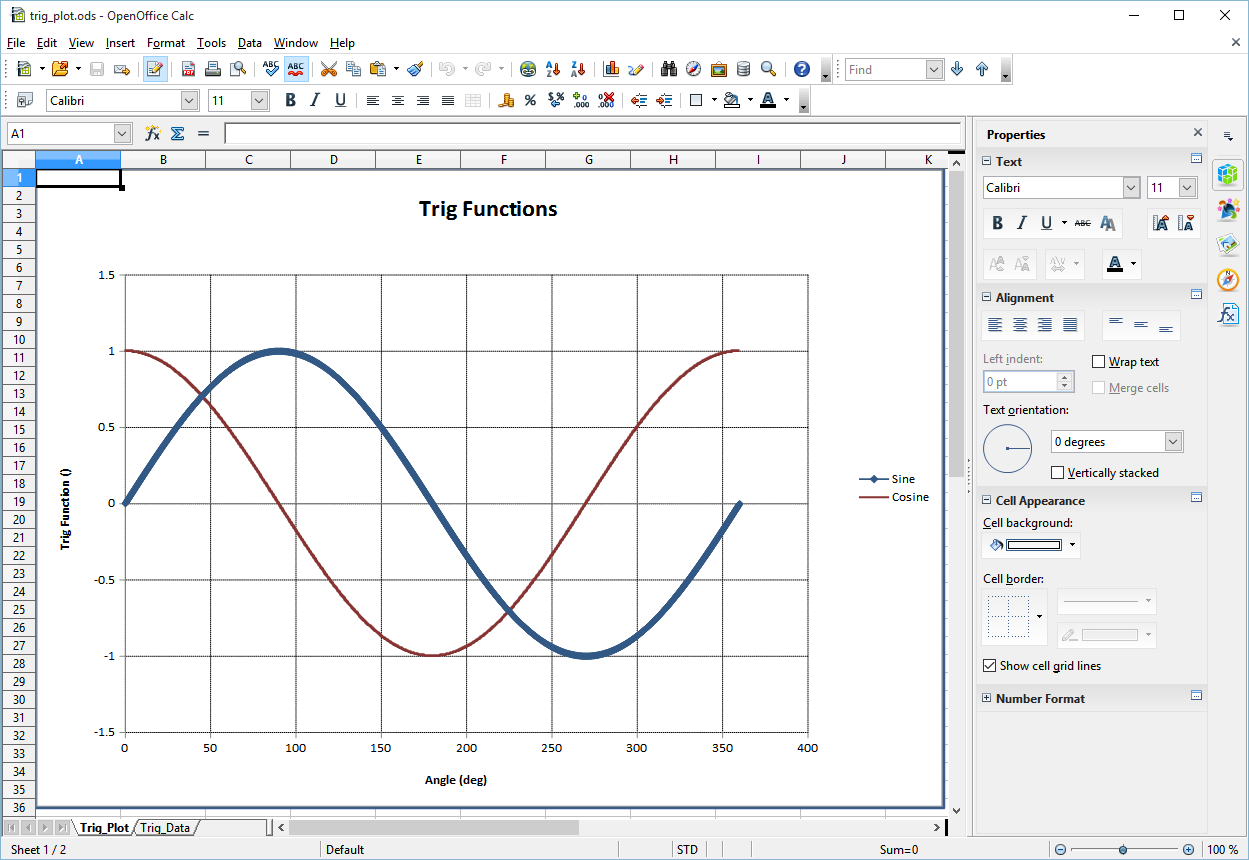
ODSCharts is normally run from a python script. For example, the script below plots sine and cosine vs angle.
The list_of_rows input variable holds the various curve labels, units and data.
Row 1 holds all of the labels of each column
Row 2 holds the units for each column (use ‘’ for no units)
Rows 3 through N hold data values.
A data sheet named “Trig_Data” is created by the add_sheet command.
A scatter plot named “Trig_Plot” is created by the add_scatter command.
Note that it identifies “Trig_Data” as the source of the data for the plot.
The columns are identified with a one-based index such that the first column is column number 1.
Note that the input xcol=1 idenifies column 1 as the X Axis.
The curves are identified as columns 2 and 3 by the input ycolL=[2,3].
The output ods file is saved as trig_plot.ods (Note the .ods is added automatically).
When saving, the flag launch=True will cause either Excel or Open Office to
launch with the named ods file, depending on which application is linked to *.ods
files. Screen shots of both Excel and OpenOffice are shown below the code.
from math import *
from odscharts.spreadsheet import SpreadSheet

mySprSht = SpreadSheet()

list_of_rows = [['Angle','Sine','Cosine'], ['deg','','']]
for iang in range( 3601 ):
    ang_deg = float(iang) / 10.0
    ang = radians(ang_deg)

    list_of_rows.append( [ang_deg, sin(ang), cos(ang)] )

mySprSht.add_sheet('Trig_Data', list_of_rows)

mySprSht.add_scatter( 'Trig_Plot', 'Trig_Data',
                          title='Trig Functions',
                          xlabel='Angle',
                          ylabel='Trig Function',
                          xcol=1,
                          ycolL=[2,3], showMarkerL=[1,0])

mySprSht.save( filename='trig_plot', launch=True)
Click images to see full size
pip Error Messages
If you get an error message that pip is not found, see https://pip.pypa.io/en/latest/installing.html for full description of pip installation.
There might be issues with pip failing on Linux with a message like:
InsecurePlatformWarning
        or
Cannot fetch index base URL https://pypi.python.org/simple/
Certain Python platforms (specifically, versions of Python earlier than 2.7.9) have the InsecurePlatformWarning. If you encounter this warning, it is strongly recommended you upgrade to a newer Python version, or that you use pyOpenSSL.
Also pip may be mis-configured and point to the wrong PyPI repository.
You need to fix this global problem with pip just to make python usable on your system.
If you give up on upgrading python or fixing pip,
you might also try downloading the odscharts source package
(and all dependency source packages)
from PyPI and installing from source as shown above at Installation From Source